

The CDEdatablog Team provides code snippet for all interactive graphs used in our posts. A very good overview to find a graph which is most appropriate for your data and story you want to tell is provided by The Data Visualisation Catalogue.
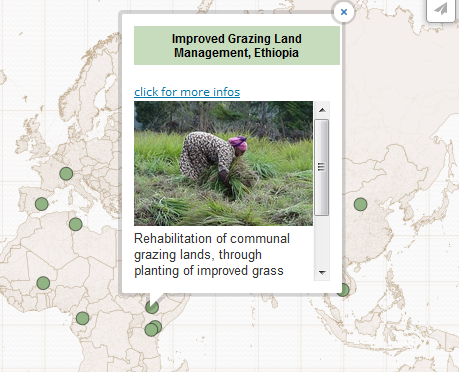
Code snippets used in our posts: Interactive maps can be used to display any information aggregated on subnational levels, such as state, provincial, or regional levels. This graph is based on a JSON file. You can use Mapstarter to transform your shapefile into a JSON file.
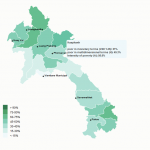
Interactive maps
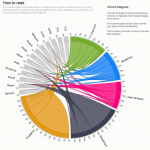
Interactive circle graphs
The Circos website contains a number of circle graphs along with tutorials and documentations on how to visualize your own data. The Circos website focuses mainly on medical data, but the graphs can easily be adapted to suit other topics.
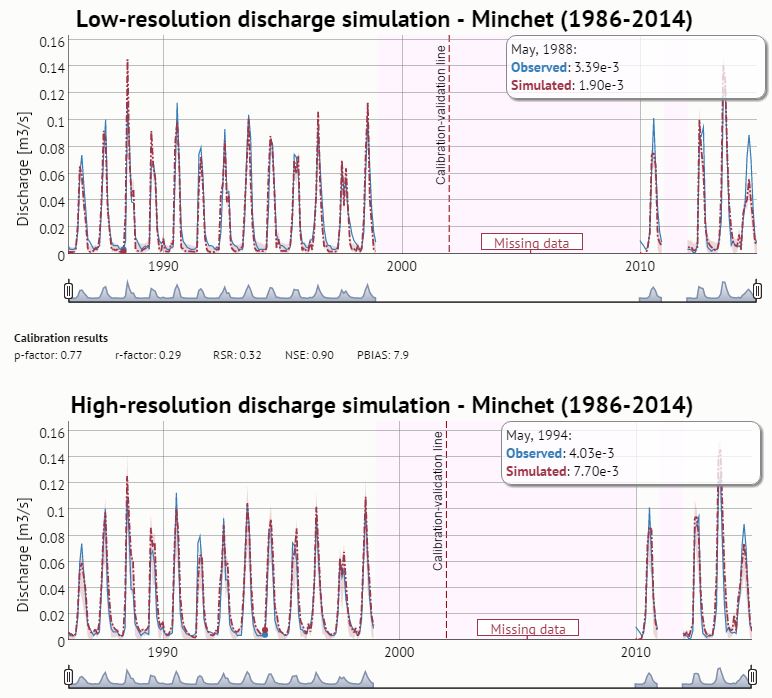
Dygraphs.js for visualizing time series
This interactive dygraph time series graph offers several possibilities:
- zooming in and zooming out
- zooming into multiple time lines simultaneously
- direct comparison of results of several timelines
- zooming width and height simultaneously
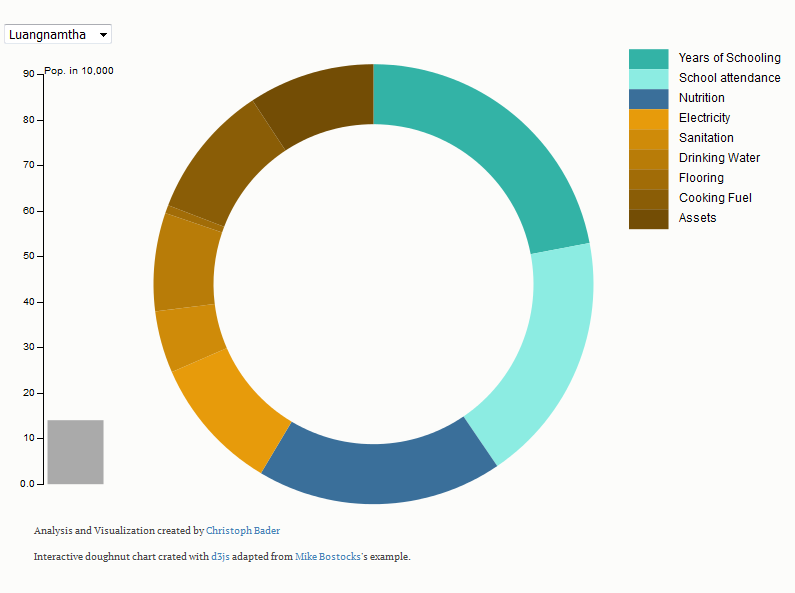
Interactive doughnut charts
A doughnut chart is useful for visualizing the contributions of different subgroups to a total. For example, you can use a doughnut chart to visualize the percentage contribution of different economic sectors to the annual economic growth rate.
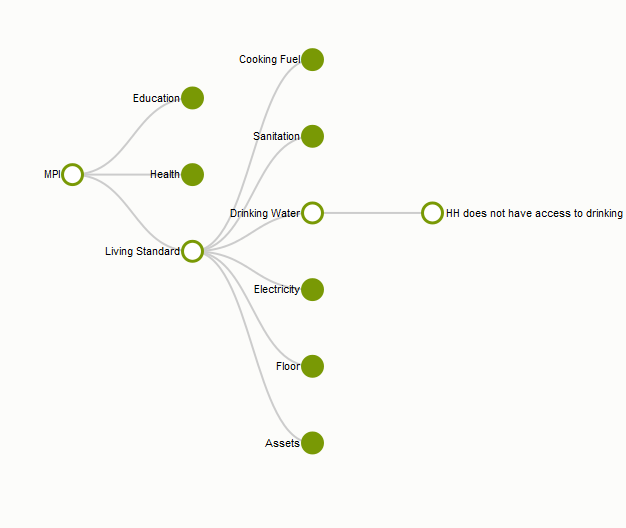
Interactive node charts
Node charts are generally used to visualize networks. In the CDEdatablog we used a node chart to visualize the composition of an index.
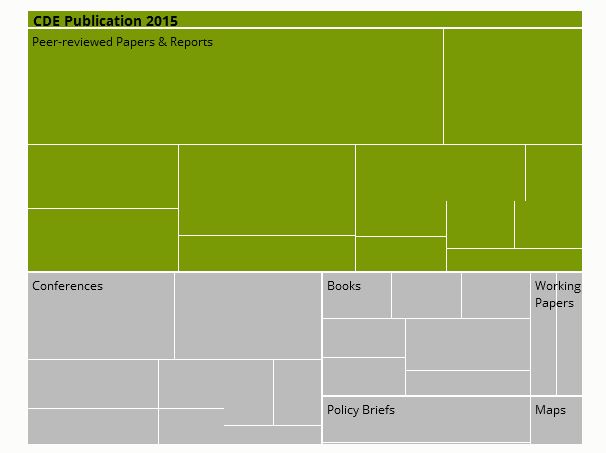
Interactive treemap
Treemaps display hierarchical (tree-structured) data as a set of nested rectangles. You can zoom into the rectangles, and you have the option of adding hyperlinks.
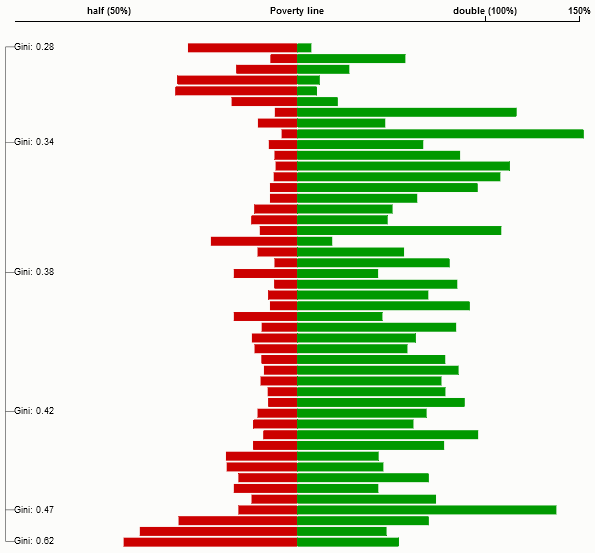
Interactive two-sided bar chart
This interactive two-sided bar chart can be used to compare two groups. In the CDEdatablog we used this chart to visualize the poverty and wealth gaps for each county in Kenya.
Map your world with cartoDB
CartoDB is a location intelligence and visualization engine that enables you to transform data into insights without much effort. With cartoDB you can easily locate your points on a webmap or produce heatmaps over time.