


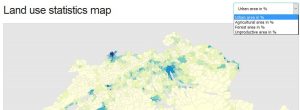
Simple data map using D3
This tutorial covers the steps taken to create a simple interactive data map using D3.js. The procedure works for different data sets. This tutorial was created by Lukas Vonlanthen for the webmap workshop held on 20–21 January 2016 at the University of Bern.
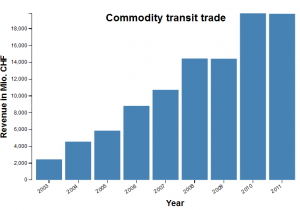
Simple bar chart using D3
This tutorial shows how to read a d3.js code presented on bl.ocks.org. This tutorial was created by Christoph Bader for the ScienceComm’ Conference held on 22–23 September 2016 in Grandson.