

Visualize a strategy
For this blog post, we used CDE’s new Strategy 2016–2021 to explore and visualize text mining techniques. Nowadays text mining is often used as a tool for text analysis. We created the visualizations following the instructions in a tutorial provided by HandsOnDataScience
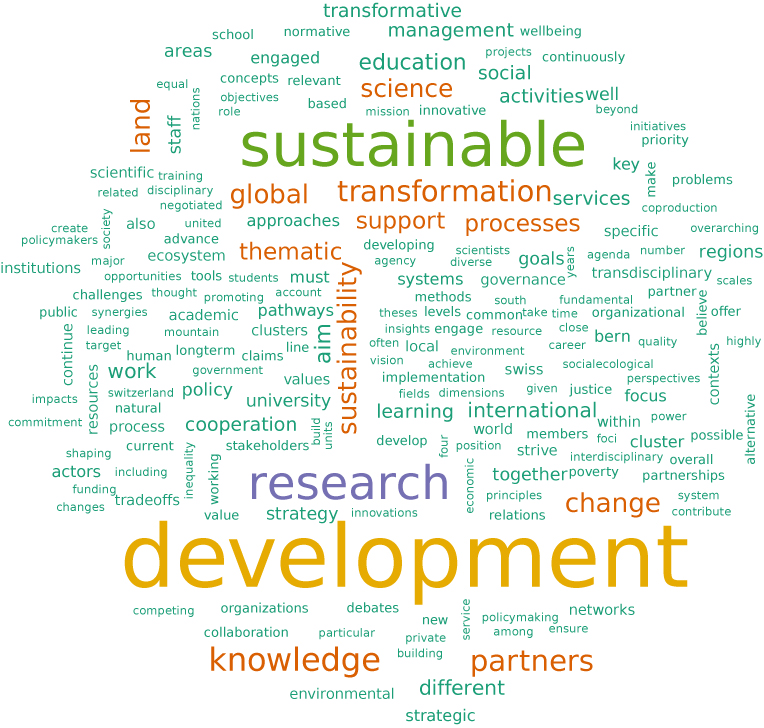
Word cloud of CDE’s Strategy 2016–2021 produced using R
Word Frequency
First we plotted the 10 most frequently used words in CDE’s Strategy 2016–2021. This is the result:
Visualization created by Christoph Bader and Vincent Roth
Responsive bar chart with d3js adapted from Josiah‘s example.
Word associations
Text mining techniques make it possible to search for specific word associations. Below we present an example showing frequent word associations with “science”, “development” and “transformation”. The R code we applied searches for associations using a correlation limit. If two words always occur together, the correlation is 1.0; if they never occur together, the correlation is 0.0. The correlation is a measure of how closely the words are associated in CDE’s Strategy 2016–2021.
Visualization created by Christoph Bader and Vincent Roth
Collapsible indented tree with d3js adapted from tchaymore‘s example.
Further reading:
- An interesting tutorial on how to use text mining techniques to analyse, for example, trade agreements is available here: https://www.r-bloggers.com/an-overview-of-text-mining-visualisations-possibilities-with-r-on-the-ceta-trade-agreement/
- Another tutorial we used for this post is available from HandsonDataScience.com: https://onepager.togaware.com/TextMiningO.pdf