

“Inequality” – a term and its consequences
Ten years on, the reverberations of the global financial crisis are as strong as ever. In the political realm, trends of polarization, protest, and nationalism have intensified. In the field of economics, however, the discourse has opened up. Instead of poverty, people are talking about inequality – and not only in development circles.
From questions of poverty to questions of distribution
The term inequality draws attention to a fundamental reality: we must adopt a broader, systemic view of poverty. Predicated on comparison, inequality reminds us that it’s not enough to study lower earners and the poor. Instead, the term demands that we expand our perspective, and take a hard look at how economic value is generated, who accumulates it, who loses it and – not least of all – how the overall system could be made fairer.
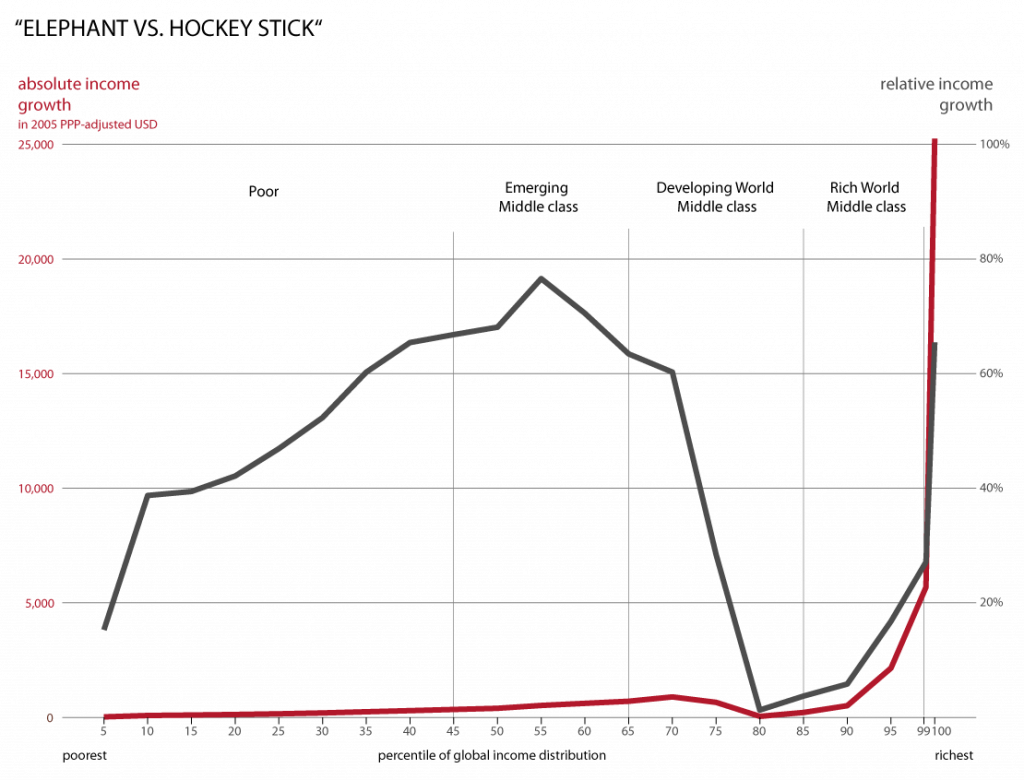
The oft-cited “elephant chart” highlights the wider discussion that is opened up by inequality. The original chart visually suggested that lower earners caught up somewhat with higher earners between 1988 and 2008. However, because growth curves starting from very low levels can appear to expand rapidly, the chart distorts the reality that is revealed by absolute income growth figures (red line): the incomes of low and middle earners barely budged over this period, while those of the richest 5 per cent accelerated upwards.
Cultivating financial wealth rather than the real economy
Not only the incomes of the richest have increased. The profits of multinational firms have also risen (green curve). Yet investments have fallen (red curve) over the same period. This suggests that profits have not been reinvested in production (new jobs, research and development, training, infrastructure), but have instead been used to pay out higher dividends or to buy back stock shares. This is vividly illustrated, for example, by Apple corporation’s allocation of profits between 2012 and 2018.
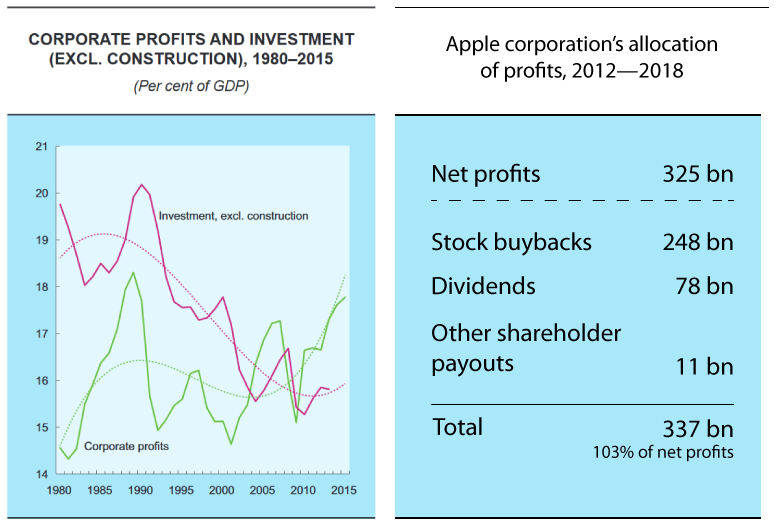
Right: Apple corporation’s allocation of profits between 2012 and 2018. Source: www.annualreports.com and https://investor.apple.com
In the last seven years, Apple has generated about USD 325 billion in profits. Of this, approximately 248 billion was spent on stock buybacks, 78 billion was paid out as dividends, and 11 billion was used for other shareholder payouts. Interestingly, Apple did not pay out dividends to shareholders prior to 2012, but instead invested in its own research and development, for example.
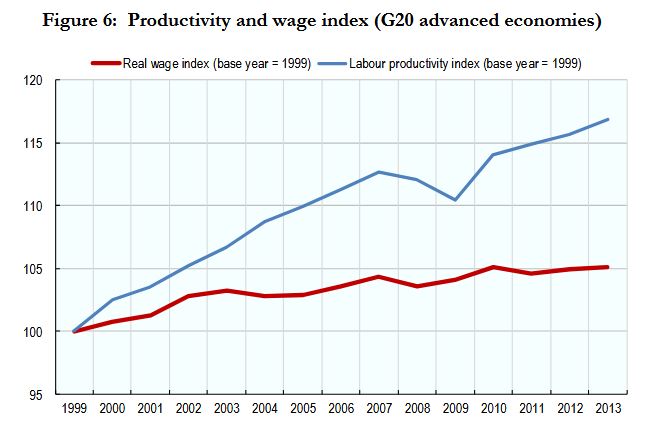
Another indication that profits are being extracted from the real economy may be seen when comparing the development of wages (red line) to labour productivity (blue line). Despite sharply rising productivity in recent decades, wages have remained flat.
Indeed, inequality is more than just a buzzword. The term sharpens our focus on factors that perpetuate poverty and lack of sustainability.
Read the CDE Policy Brief on inequality
Lannen A, Bieri S, Bader C. 2019. Inequality: What’s in a Word? CDE Policy Brief, No. 14.
Bern, Switzerland: CDE.